私事ですが、GitHub で pyscience11 というライブラリを公開しています。 このライブラリは Header-Only で、C++ から NumPy, SciPy, Matplotlib を手軽に使うことができます。 動作には pybind11 が必要です。
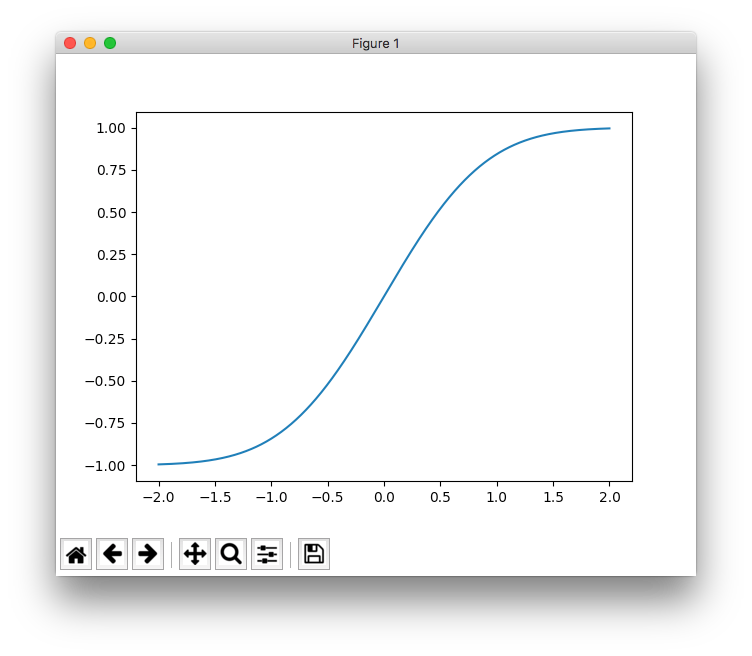
次の例では、pybind11 の組み込み Python 環境で誤差関数 (erf) を表示しています。
#include <pybind11/embed.h>
#include <pybind11/pybind11.h>
#include <pyscience11/matplotlib.h>
#include <pyscience11/matplotlib/pyplot.h>
#include <pyscience11/numpy.h>
#include <pyscience11/scipy/special.h>

namespace py = pybind11;
namespace m11 = matplotlib11;
namespace n11 = numpy11;
namespace s11 = scipy11;

int main(void)
{
    // 組み込み Python インタプリタを起動する
    py::scoped_interpreter interpreter;

    // numpy と scipy.special を読み込む
    auto numpy = n11::import_numpy();
    auto scipy_special = s11::scipy::import_special();

    // 誤差関数 (erf) を計算する
    auto x = numpy.linspace(-2, 2, 1001, py::arg("dtype") = numpy.attr("float32"));
    auto y = scipy_special.erf(x);

    // matplotlib を読み込み、バックエンドを設定する
    auto matplotlib = m11::import_matplotlib();
    matplotlib.use("TkAgg");

    // グラフを描画する
    auto pl = m11::matplotlib::import_pyplot();
    pl.plot(x, y);
    pl.show();

    return 0;
}
Python を実行ファイルに組み込むため、Python 3.6 にリンクしています。 また、pybind11 と pyscience11 のヘッダファイルのパスを指定しています。
$ # macOS Sierra (10.12)
$ clang sample.cpp -std=c++11 -I/usr/local/Cellar/python3/3.6.4_2/Frameworks/Python.framework/Versions/3.6/include/python3.6m -I/usr/local/include/python3.6m -L/usr/local/Cellar/python3/3.6.4_2/Frameworks/Python.framework/Versions/3.6/lib -lc++ -lpython3.6m -o sample
このプログラムを実行すると、次の通りグラフが表示されます。

STL との連携
pyscience11 では、pybind11 の STL 連携機能を使うことができます。 pybind11/stl.h をインクルードすると、std::vector などを引数として Matplotlib を呼び出すことができます。
#include <pybind11/embed.h>
#include <pybind11/pybind11.h>
#include <pybind11/stl.h>
#include <pyscience11/matplotlib.h>
#include <pyscience11/matplotlib/pyplot.h>

namespace py = pybind11;
namespace m11 = matplotlib11;

int main(void)
{
    // 組み込み Python インタプリタを起動する
    py::scoped_interpreter interpreter;

    // 正弦関数 (sin) を計算する
    std::vector<float> x, y;
    for (int i = 0; i <= 1000; ++i)
    {
        float xi = M_PI * (i - 500) / 500.f;
        float yi = sinf(xi);
        x.push_back(xi);
        y.push_back(yi);
    }

    // matplotlib を読み込み、バックエンドを設定する
    auto matplotlib = m11::import_matplotlib();
    matplotlib.use("TkAgg");

    // グラフを描画する
    auto pl = m11::matplotlib::import_pyplot();
    pl.plot(x, y);
    pl.show();

    return 0;
}
このプログラムを実行すると、次のグラフが表示されます。

インストール
このライブラリは Header-Only なので、pybind11 と pyscience11 のヘッダファイルをダウンロードするだけで使えます。 pip を使いシステムディレクトリにインストールすることもできます。
$ # pybind11 をインストールする(pyscience 11 の実行に必要です)
$ pip install pybind11
$
$ # pyscience11 をインストールする
$ pip install pyscience11
参考資料
-
pybind11 で C++ から Python インタプリタを実行する
https://yokaze.github.io/2018/02/11/ -
pybind11 上の matplotlib で macosx バックエンドを使う
https://yokaze.github.io/2018/02/24/ -
pybind/pybind11: Seamless operability between C++11 and Python
https://github.com/pybind/pybind11 -
yokaze/pyscience11: C++11 wrapper for NumPy, SciPy and Matplotlib using pybind11
https://github.com/yokaze/pyscience11